
Catatumbo Lightning
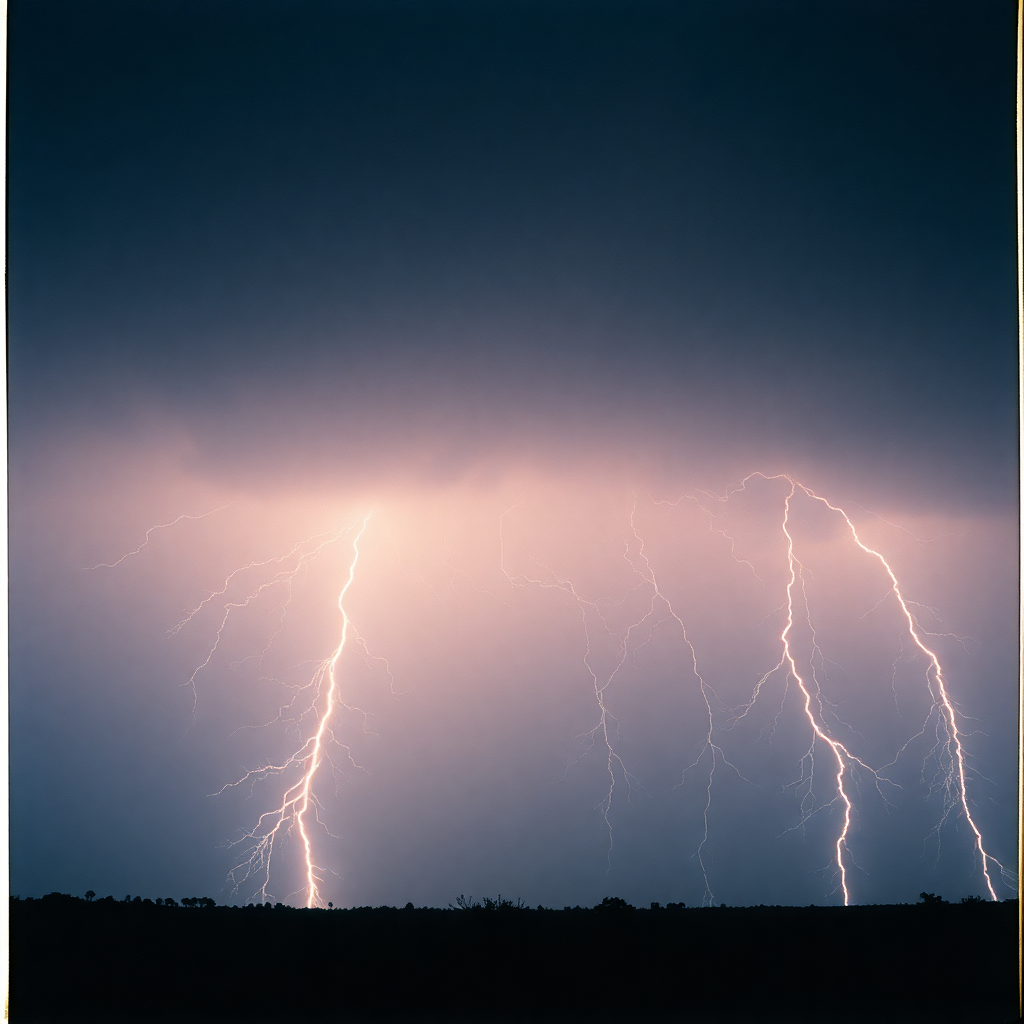
Over the mouth of the Catatumbo River, where it spills into Venezuela's Lake Maracaibo, lightning storms flare on 140 to 160 nights a year, up to nine hours at a stretch. It is Earth's most lightning-dense spot and holds a Guinness World Record. Far from a mystery, it is a textbook case of geography: mountains, a warm lake, and converging night winds that brew storms almost daily.
Mechanism settled
Mostly supported
7 supported · 1 contested · 1 open
The basin is the whole story
Lake Maracaibo sits in a basin ringed on three sides by the Andes and the Perijá mountain range. It's large, shallow, and warm — the kind of lake that generates moist, rising air all day. At night, cooler air drains off the surrounding mountains and funnels into the basin, colliding with that warm, humid column. The result is almost mechanical: a nocturnal low-level jet that NASA's Earthdata team identified as the key driver of convective storms that fire on roughly 140 to 160 nights a year, lasting up to nine hours at a stretch.
This is not a mystery that resists explanation. The geography does the work. The mountains channel the wind, the warm lake provides the moisture, and the collision happens so reliably that sailors historically used the storm as a navigational beacon. The locals have a name for it: the Lighthouse of Maracaibo.
The numbers aren't subtle
In 2016, Albrecht et al. published a peer-reviewed study in the Bulletin of the American Meteorological Society drawing on 16 years of NASA TRMM satellite data — the most comprehensive global lightning dataset assembled to that point. The result was unambiguous: Lake Maracaibo ranked as Earth's number-one lightning hotspot at approximately 233 flashes per square kilometre per year, displacing the Congo Basin from the top spot it had long held.
NASA confirmed the finding the same month. Guinness World Records has the record officially at almost 250 flashes per square kilometre per year, a slight difference that reflects different methodologies and time windows rather than any real dispute about what's happening. Both numbers are, by any measure, absurd.
What the explanations don't explain
The mechanism is solved. What isn't: the fine-grained variability. In early 2010, the lightning went quiet for approximately six weeks — an unusual pause that drew considerable attention and some speculation about climate-related causes. It resumed. Why it paused, and what exactly modulates the storm's year-to-year behavior, remains an active area of atmospheric research rather than a closed question. The Catatumbo lightning is a solved mystery that keeps generating new data problems. That's a reasonable place to land.
How we know this
Built from 5 sources — 3 first-hand · 2 background & context, incl. 1 academic / technical. 0 of the 3 figures here are drawn directly from those sources.
- Earth's New Lightning Capital Revealed — NASA (May 2, 2016)Public record — free to reuseaccessed 2026-05-21
- The Maracaibo Beacon — NASA Earthdata (April 19, 2021)Public record — free to reuseaccessed 2026-05-21
- Albrecht et al. — Where Are the Lightning Hotspots on Earth? (Bulletin of the American Meteorological Society, 2016)Quoted or summarized under fair use — follow the link for the originalaccessed 2026-05-21
- Highest concentration of lightning — Guinness World RecordsQuoted or summarized under fair use — follow the link for the originalaccessed 2026-05-21
- Catatumbo lightning — WikipediaCreative Commons — reuse allowed with attribution, share-alikeaccessed 2026-05-21
This account draws on publicly available sources and historical records. Report a factual error → How we source and correct →
The Case File
CONTESTEDWhat's still open
The mechanism is solved — basin topography, warm lake, nocturnal mountain winds, a low-level jet. What remains open is interannual variability: what drove the ~6-week silence in early 2010, and how climate shifts will affect storm frequency over the coming decades.
What would change our mind
A first-principles atmospheric model that predicts both the geographic lock-in of the storm zone and the 2010 pause from physical inputs alone — or evidence that the storm zone has migrated or attenuated in ways the current topographic account can't explain.